The Right Data brings out the Root Cause
Jun 18, 2024
The principal at a K-8 school could not understand why their school label was not improving. They had a “C” school label for the past 3 years. We began reviewing and analyzing their data assessment for those 3 years to determine root causes and patterns. They had a goal to improve their proficiency by 15%, they had a research-based program, so why were their results “flatlining” (Flatlining results are results that are stuck and only change 1-2% over 3 years)?
We dug deeper into their data and looked at the 4 proficiency levels in Arizona.
1) Minimally Proficient (MP, lowest level)
2) Partially Proficient (PP)
3) Proficient (P, at level or benchmark)
4) Highly Proficient (HP, above level)
Most states have state test scores that reflect performance on multiple levels. In Arizona, proficiency points are weighted and awarded at each level. MP = 0, PP = .6, P = 1 and HP = 1.3.
As we dug deeper into their data, we discovered the root cause of their data problem. They were moving students into proficiency, but those same students dropped back to a lower level after 1-2 years. Their data flatlined because, for every student they moved into proficiency, another student dropped out of proficiency.
When we discovered this pattern in the data, we began to ask “Why?”. When they started, they had many students at the bottom level, MP. The school brought in training specific to moving struggling students. It was successful for a couple of years, but now, they had a different issue.
With more students reaching proficiency, they needed new strategies for challenging and maintaining proficient students. It was a new problem and a great problem to have. The data climate was safe, and the teachers admitted that they did not know how to teach those strategies. The principal brought in the training. The teachers focused on both types of students at the top end and bottom end. And it worked! The next year, they achieved a B label!
Do you experience the same problems as the school in the above story?
Are you paying attention to students at different levels and tracking their results?
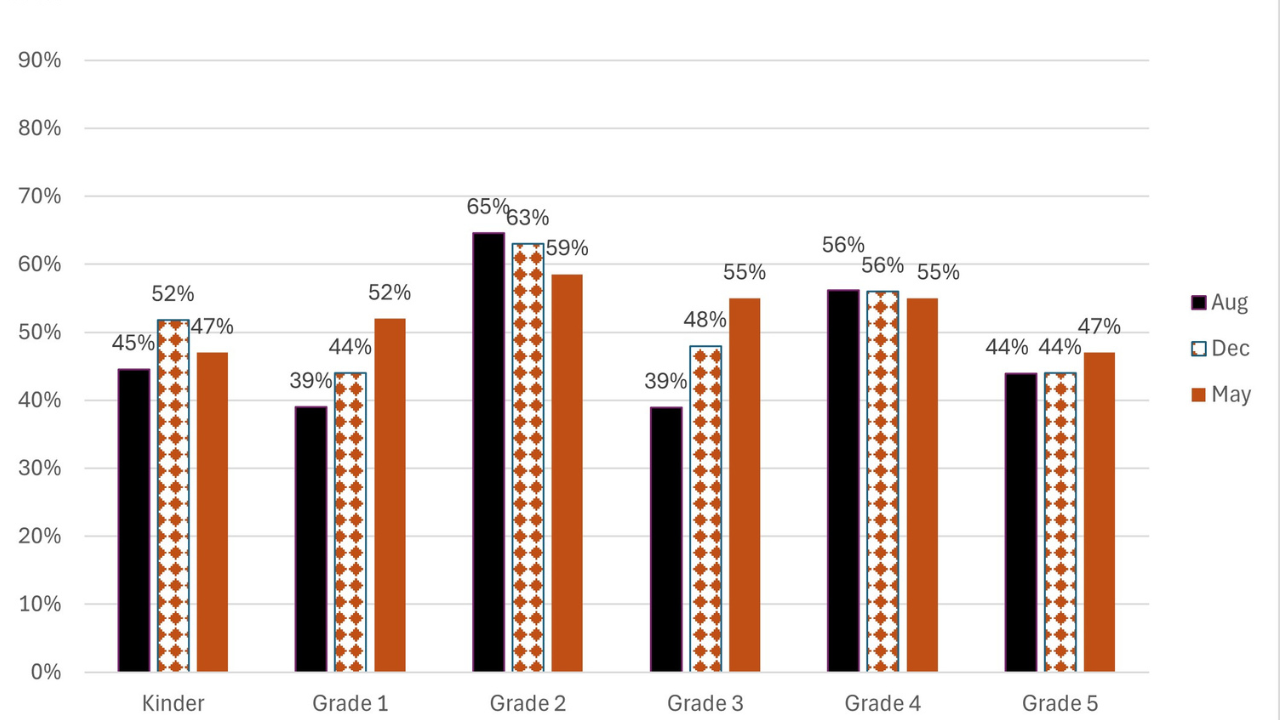
Within the data profile, I recommend a chart that is updated at the end of every year that includes student performance within the different levels over time. Here is an example chart at a grade level over a 3-year time span.

Keeping it simple, in this data set, you can quickly see that the students at the proficient level are stuck and not moving. In fact, they are not moving anyone into the highly proficient area. Now that many of you are reviewing your year-end data, I recommend creating a simple graph that will help you determine if each of the performance levels within your assessment is moving in the right direction.
Partially proficient is a difficult category to track on a bar chart. This is because students could be tagged as PP if they move up from MP or fall back from the Proficient level. The best way to look at PP is to monitor individual student data within PP and count how many students moved up from MP or moved back from Prof.
If you do not have time and would like help in creating your data profile and monitoring this data, please contact me for details on my done-for-you data package. You can find more details here: https://debradurma.com/star-services for the A-F calculator or School-Student Data Profile.
If you’re interested in getting more assistance with your data profile or A-F goals, request a FREE consultation call with me. Fill in the Contact Form Link: https://debradurma.com/contact-us
Type in “Yes” for “Are you Interested in STAR Leadership Data Solutions?” You will receive a follow-up email with the next step to schedule a phone call to discuss your needs and questions.
Download School Leaders Data Playbook for Success!
This playbook breaks the process into four clear steps that help
you focus on what matters most. In my book, School and Student Data Secrets, I share these proven strategies to simplify
data use, break free from stagnant outcomes, and create lasting
improvements in your school.
Many school leaders encounter data challenges that can feel overwhelming, but addressing these issues can lead to rewarding outcomes. Through collaboration with numerous educational leaders, effective strategies have emerged that can be applied within your own school. These insights and practical approaches are detailed in my new book, 'School and Student Data Secrets.' If you’re looking to uncover strategies for meaningful progress, you can find more information here:

